
Some of you are probably thinking I’ve already given up on my compote tree (in the same way as I give up on so many of my projects after an initial flurry of interest).
Far from it.
Like the tree itself, I may look as if I’m standing still, but things are always moving, creeping out into the light.
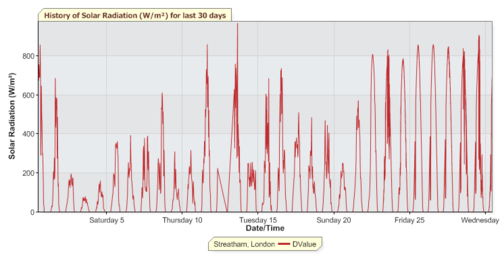
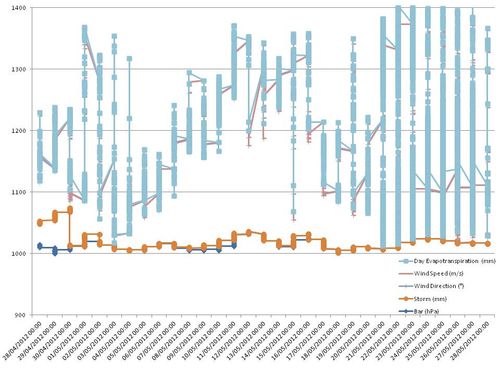
For example, I have been watching the weather. Thanks to the very marvellous London Grid For Learning Weather Monitoring System, I have been grabbing all the relevant data from the Streatham weather station. Here, for example, is a spreadsheet with all the weather data for my area for the last 30 days or so: Download Streathamweatheraprmay2012
This weather station is only 5 mins walk from my house so the conditions it is describing are – I would assume – relevant to my tree.
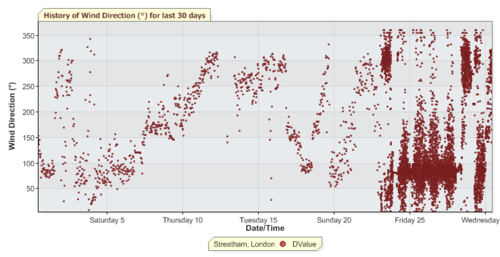
As an experiment, I have tried various ways of cross referencing this data and re-charting it to see if I can find patterns or ‘meaning’.
In order to protect myself from imposing something on the data that my mind might be deliberately looking for, I have been careful not to put much thought or strategy (or indeed *knowledge*) into making these charts, but have simply let the machine generate something for me. That way some interesting patterns might emerge.
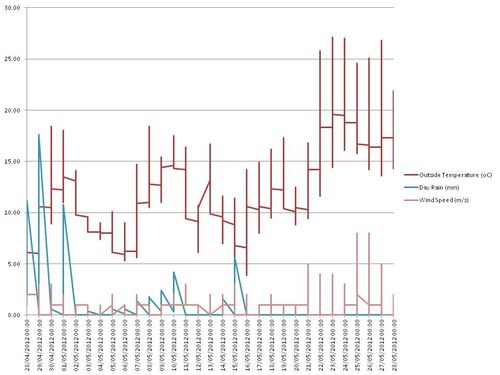
I was right! As with the patterns made by the tree branches (as mentioned in a previous post) it’s clear there are messages here.
Any thoughts you might have about how to interpret these charts – or indeed about how to visualise the weather data in general – please let me know.
My next task in this area will surely be to take the weather station feed and create my own web-based monitoring system. I have much to learn and do.
And then there is the knotty issue of monitoring the tree itself. I have already created a spreadsheet for that too ( Download Compotetreedata), and I intend to start taking measurements with rudimentary instrumention at the beginning of the month. Watch this space!

Leave a comment